Preparation of Nd:YLF Raw Materials by Melting Method and Study on Their Crystal Growth and Properties - 04
2 Results and Discussion
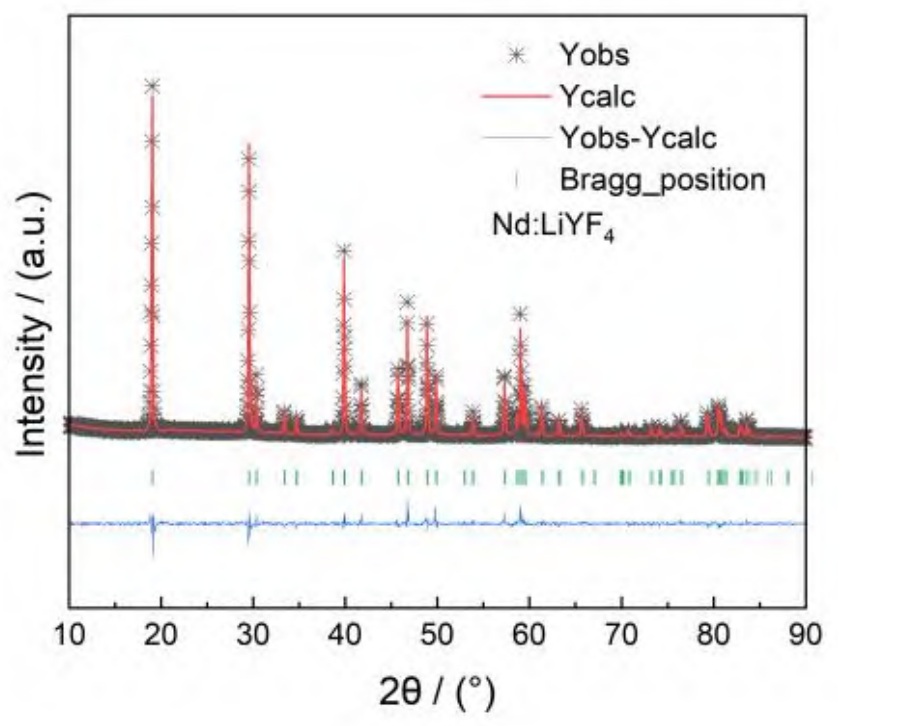
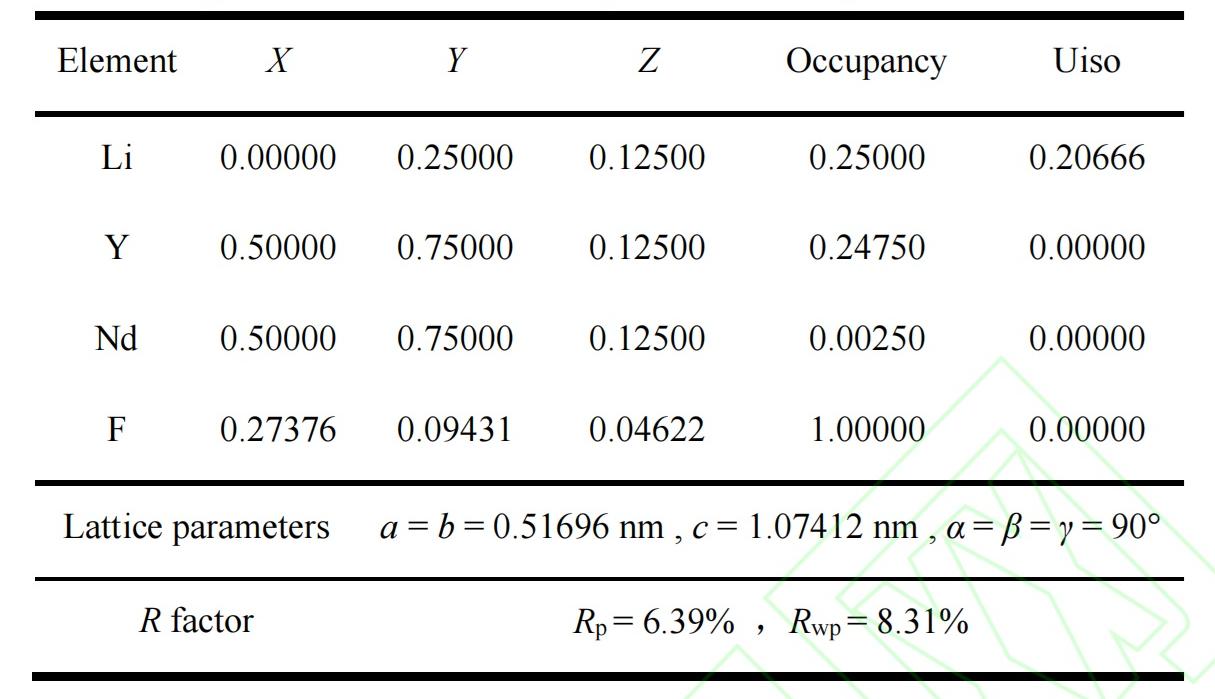
In order to obtain more crystal structure information, the Rietveld method was used to refine the structure of Nd:YLF (www.wisoptic.com) crystal powder sample. The structural data of YLF crystal was used as the initial data for refinement. Nd3+ and Y3+ are in the same lattice position in the unit cell. The refinement results are shown in Figure 7. It can be seen that the fitting results are in good agreement with the experimental results. The fitting results of parameters such as lattice constant, atomic coordinates, atomic occupancy, and temperature factor are shown in Table 1. The fitting full spectrum factor Rp and weighted full spectrum factor Rwp are 6.39% and 8.31%, respectively, both less than 10%, which further indicates that the crystal has good phase purity. After a small amount of Nd3+ is added to the YLF single crystal to replace the lattice position of Y3+, the crystal phase structure of YLF itself does not change much. The crystal cell parameters obtained by refinement are a=b=0.51696 nm, c=1.07412 nm, which are slightly larger than those of pure YLF crystal (a=b=0.5164 nm, c=1.0741 nm). This is because the ionic radius of Nd3+ is slightly larger than that of Y3+, and when Nd3+ replaces Y3+, it causes a slight expansion change in the unit cell parameters.
Fig. 7 Rietveld fitting curves of X-ray powder diffraction of Nd:YLF crystal
Table 1 Structural parameters of Nd:YLF crystal obtained by Rietveld refinement method
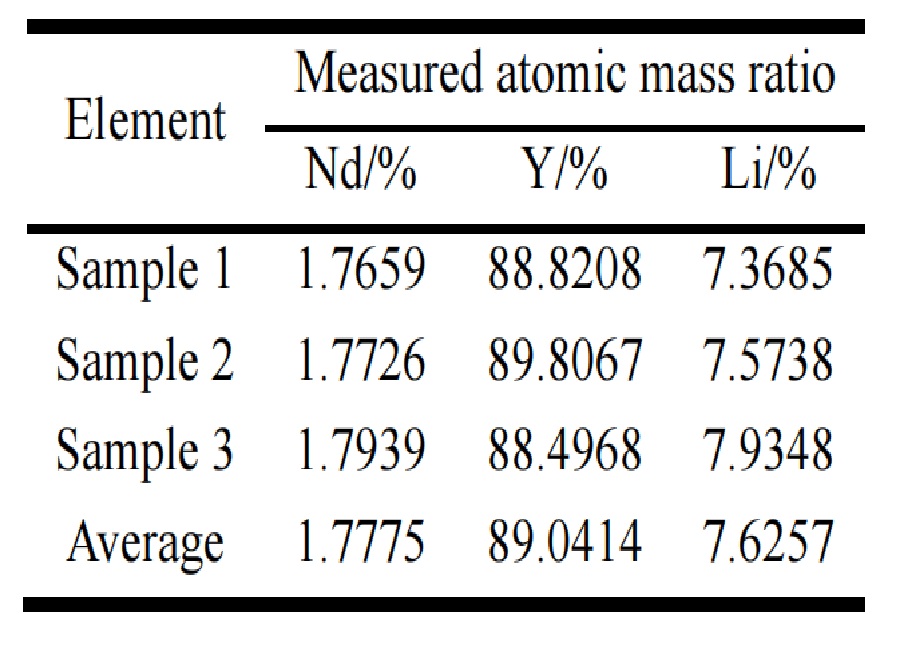
Accurate determination of the segregation coefficient of doped ions in crystals is an important reference for guiding the preparation of raw materials for crystal growth and the optimization of crystal growth process. The LA-ICP-MS method can directly measure the element content in solid samples. Compared with acid-base digestion samples, laser ablation samples have the advantages of quasi-nondestructiveness and simple sample pretreatment. In order to reduce the measurement error, three samples were selected from the initial shoulder of the Nd:YLF crystal (www.wisoptic.com) to test the element mass ratio. The measurement results are shown in Table 2. After calculation, it can be obtained that the concentration of Nd3+ in the crystal is 1.2% atomic fraction. The concentration of Nd3+ in the prepared raw materials is 4.0% atomic fraction, which is the concentration in the melt at the initial shoulder of crystal growth. Therefore, the segregation coefficient of Nd3+ in Nd:YLF crystal can be calculated by formula (2):
K=Cs/Cl (2)
In the formula, K is the segregation coefficient of the doped ions; Cs represents the doping concentration of Nd3+ in the crystal; Cl represents the initial concentration of Nd3+ in the melt. The calculated segregation coefficient of Nd3+ in Nd:YLF crystal is 0.3, which is higher than 0.2 in Nd:YAG crystal. A large segregation coefficient is conducive to achieving high-concentration doping of ions, thereby improving laser efficiency. At the same time, a large segregation coefficient also means that the doped ions can easily enter the crystal, which is conducive to high-quality crystal growth and rapid crystal growth, and can also reduce the cost of crystal growth.
Table 2 The elements mass ratio results of Nd: YLF crystal tested by LA-ICP-MS method
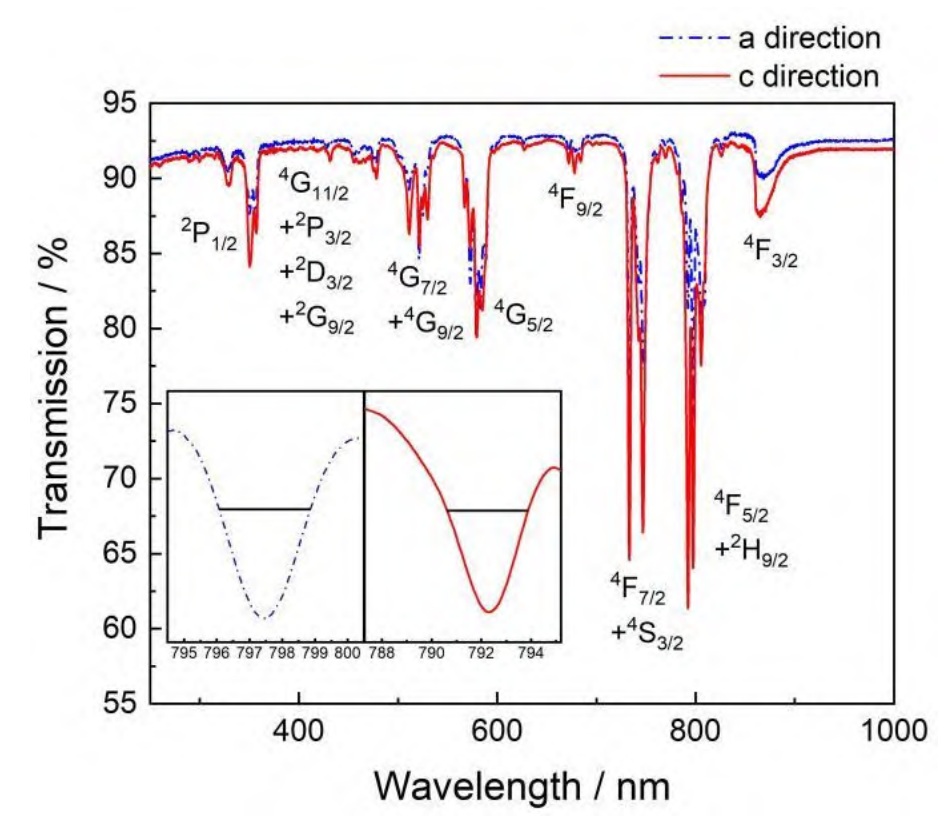
Figure 8 is the transmission spectrum of the Nd:YLF (www.wisoptic.com) crystal sample in the range of 250~1000 nm measured at room temperature. It can be seen that there are a total of 8 absorption bands, as marked in the figure, corresponding to the energy level transitions of Nd3+ from 4I9/2 to different excited states 4D1/2 + 4D3/2 + 4D5/2 + 2L15/2, 2P1/2, 4G7/2 + 4G9/2 + 2K13/2, 4G5/2, 4F9/2, 4S3/2 + 4F7/2, 4F5/2 + 2H9/2 and 4F3/2. Among them, the strongest absorption peak of the a crystal direction is at 797.4 nm, and the strongest absorption peak of the c crystal direction is at 792.3 nm. The corresponding absorption half-peak width (FWHM) reaches 3.0 and 3.3 nm respectively, which is about twice that of Nd:YAG crystal, as shown in the inset of Figure 8. The wide absorption peak is not only conducive to the laser crystal to absorb the pump light more strongly and improve the pump efficiency, but also reduces the temperature control requirements for the pump light source, which can effectively improve the stability of the laser output power and beam quality.
Fig. 8 Transmission spectra of Nd:YLF crystal at room temperature

