High-Power Mid-Infrared Ultrafast Sources at 2 - 5μm Based on Dual-Wavelength Source - Part 8
3 Difference frequency generation of high-power mid-infrared ultrafast light sources
3.2 Difference frequency generation for producing high-power mid-infrared ultrashort pulses at 3μm
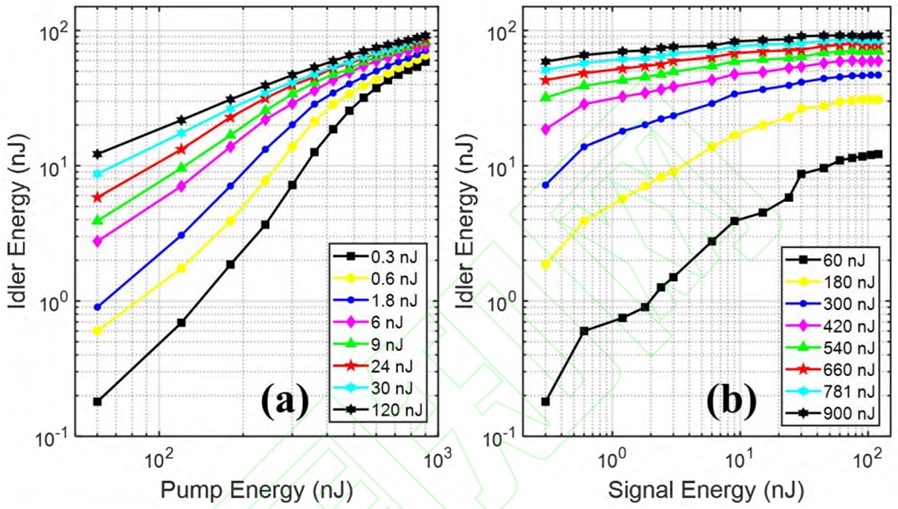
The time delay line was adjusted to synchronize the pump pulse and signal pulse in time, and the variation of mid-infrared output power with pump power and signal power was measured respectively. The results are shown in Figure 9.
Fig.9. In the experimental output of the idle light energy changes with the pump light and signal
light energy after optimized delay
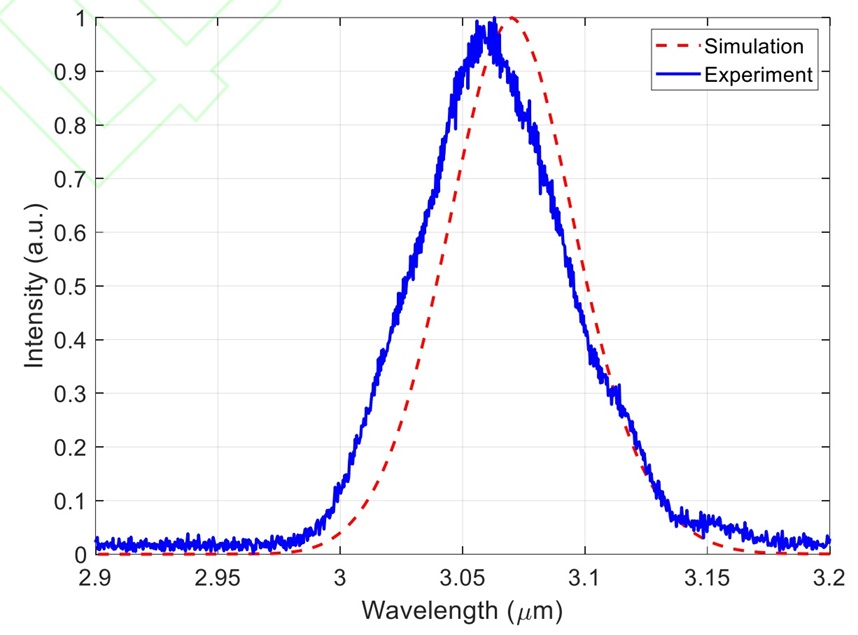
During the measurement, the delay line was optimized to ensure maximum output mid-infrared power. In Figure 9(a), when the signal energy is 0.3 nJ (black squares), the idler energy initially increases exponentially with the pump energy, reaching saturation after the pump energy exceeds 600 nJ. This trend is consistent with the trend in Figure 3(a) where the signal energy is 0.1 nJ and the pump energy varies between 100 and 3.5 μJ. As the signal energy increases to 9 nJ (green triangles), the nonlinear interaction significantly enhances, and the pump energy required to reach saturation decreases to 240 nJ. When the signal energy is 120 nJ (black hexagonal star), the idler energy enters the saturation region after the pump energy exceeds 120 nJ, consistent with the curve corresponding to the signal pulse energy of 100 nJ in Figure 3(a). Due to the delay optimization, the idler energy curve converges to its maximum value in an orderly manner, consistent with the trend of the curve in Figure 3(a). Judging from the idler energy curve, the DFG operates in the saturation region when the pump energy is 900 nJ and the signal energy is 120 nJ, consistent with the corresponding energies in Figure 3(a). Figure 9(b) shows the idler energy versus signal energy curve for different pump energies (60-900 nJ). Compared to the growth pattern of the curve in Figure 3(b), the pulse energy corresponding to the parameters in Figure 9 is higher, resulting in no region where the idler energy increases linearly with the signal energy. The idler growth rate gradually slows down at all pump energies. When the pump energy is only 60 nJ (black squares), no obvious saturation is observed. When the pump energy is 540 nJ (green triangles), the signal energy required to reach the saturation region is 45 nJ. When the pump energy is 900 nJ, the signal energy required to reach the saturation region is 9 nJ, consistent with the simulation pattern in Figure 3(b). When the pump light energy is 900 nJ and the signal light energy is 120 nJ, the output mid-infrared idler light energy is 92 nJ, with a repetition rate of 33.3 MHz, corresponding to an average power of 3.06 W. The idler light spectrum is shown in Figure 10. The spectrum has a central wavelength of 3.06 μm and a full-width at half-maximum of approximately 70 nm. The red dashed line is the mid-infrared spectrum calculated using the output parameters of the dual-wavelength laser. The experimental and simulated spectrum widths are nearly identical, with a slight shift in the central wavelength due to a slight difference in the effective polarization period of the PPLN (www.wisoptic.com) crystal in the experiment and the simulation.
Fig. 10. The final output of the mid-infrared spectrum


