Русский
 Deutsch
 Español
 Français


Research on Mid-Infrared Parametric Oscillators - Part 06
3. Experimental Results and Analysis
3.2 Output Characteristics of OPO
The spacing between coupling lenses M1 and M2, which pump the MgO:PPLN (www.wisoptic.com) fiber pulsed laser described above, was adjusted. Using a focal spot analyzer, the beam waist diameter of the focused spot was observed to be 200 μm (as shown in Figure 7). The position of the MgO:PPLN crystal was adjusted to ensure the beam waist was centered within the crystal. The effect of the transmittance of the output mirror M4 on the mid-infrared laser output power was analyzed, as shown in Figure 7. It can be seen that the mid-infrared laser power increases nearly linearly with the increase of pump power. When the signal light transmittance of the output mirror is 0%, 10%, 20%, and 30%, the threshold pump powers of the 3817 nm laser are 7.2 W, 12.4 W, 16.3 W, and 24.5 W, respectively. At the maximum pump power, the output powers are 5.93 W, 5.24 W, 5.05 W, and 4.06 W, respectively, corresponding to optical-to-optical conversion efficiencies of 13.5%, 11.9%, 11.5%, and 9.2%. This is because the cavity loss increases with the increase of the signal light transmittance of the output mirror M4. At low power pumping, the signal light power density in the resonant cavity with higher transmittance is relatively small, making it difficult to achieve three-wave frequency conversion, thus resulting in a higher output threshold. The optical-to-optical conversion efficiency was analyzed under different transmittances, as shown in Figure 8. It can be seen that with increasing pump power, the optical-to-optical conversion efficiency of mid-infrared laser first increases and then decreases, eventually stabilizing. This is because under low-power pumping, due to the low power density of the three waves within the cavity, the output power of the mid-infrared laser increases linearly with increasing pump power. When the transmittance of the output mirror is 0%, 10%, and 20%, the pump powers required for the maximum optical-to-optical conversion efficiency are 12.4 W, 16.4 W, and 23.4 W, respectively. Further increasing the pump power leads to a reversal effect when the power density of the idler and signal beams within the cavity reaches a certain value, causing idler energy to flow back, thus reducing the optical-to-optical conversion efficiency. Simultaneously, MgO:PPLN (www.wisoptic.com) exhibits long-wavelength absorption characteristics and strong absorption of 3.8 μm laser light. Under high-power pumping, it exhibits a strong thermal lensing effect, affecting intracavity mode matching, which is also a reason for the decrease and instability of the optical-to-optical conversion efficiency.
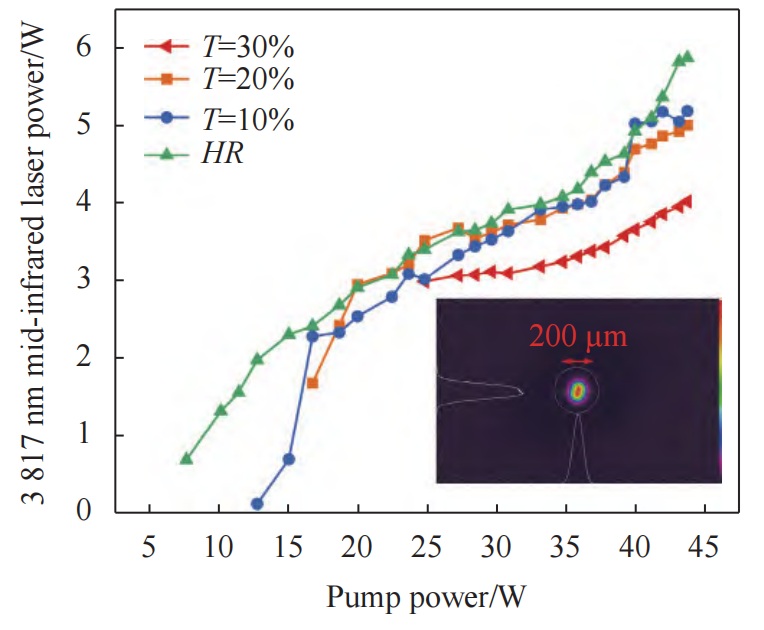
Fig. 7 The diagram of 3 817 nm laser power under different output mirror transmittances and the focused spot
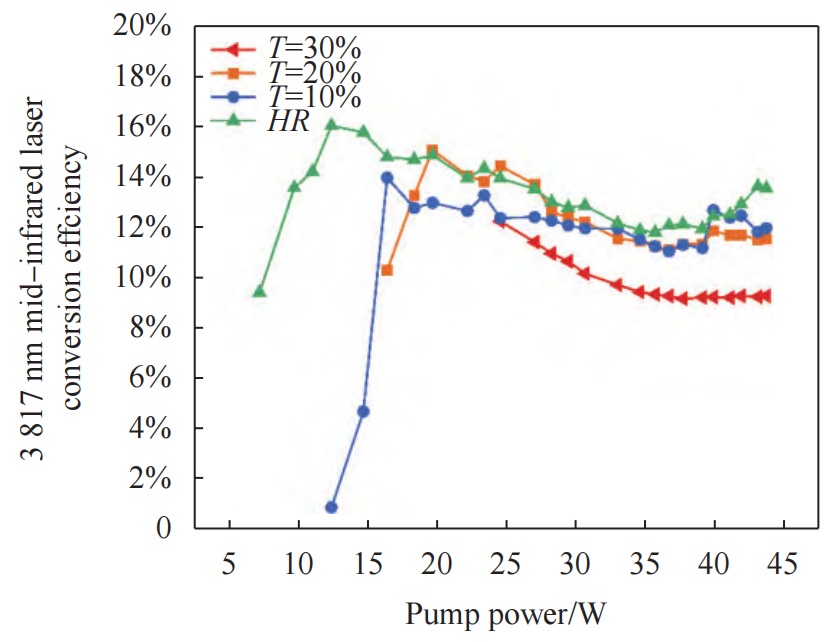
Fig. 8 The diagram of 3817 nm laser conversion efficiency under different output mirror transmittances
The temporal signal of the signal light was monitored using an InGaAs photodetector, as shown in Figure 9. At maximum pump power, the laser pulse widths for different output mirror transmittances were 94.6 ns, 95.8 ns, 89.8 ns, and 92.4 ns, respectively. Compared to the pump laser pulse width, the signal light pulse width was compressed to varying degrees. This is because OPO has a certain oscillation threshold, and the pump laser uses acousto-optic Q-switching, resulting in a relatively low power density at the pulse-front edge of the output laser, causing the parametric light to establish up later than the pump light. Simultaneously, the pump power density is relatively high in the middle of the pump pulse, allowing the parametric light to oscillate rapidly, ultimately resulting in a shorter pulse-front edge for the parametric light compared to the pump light. Throughout the process, the parametric light pulse width is smaller than the pump light pulse width.
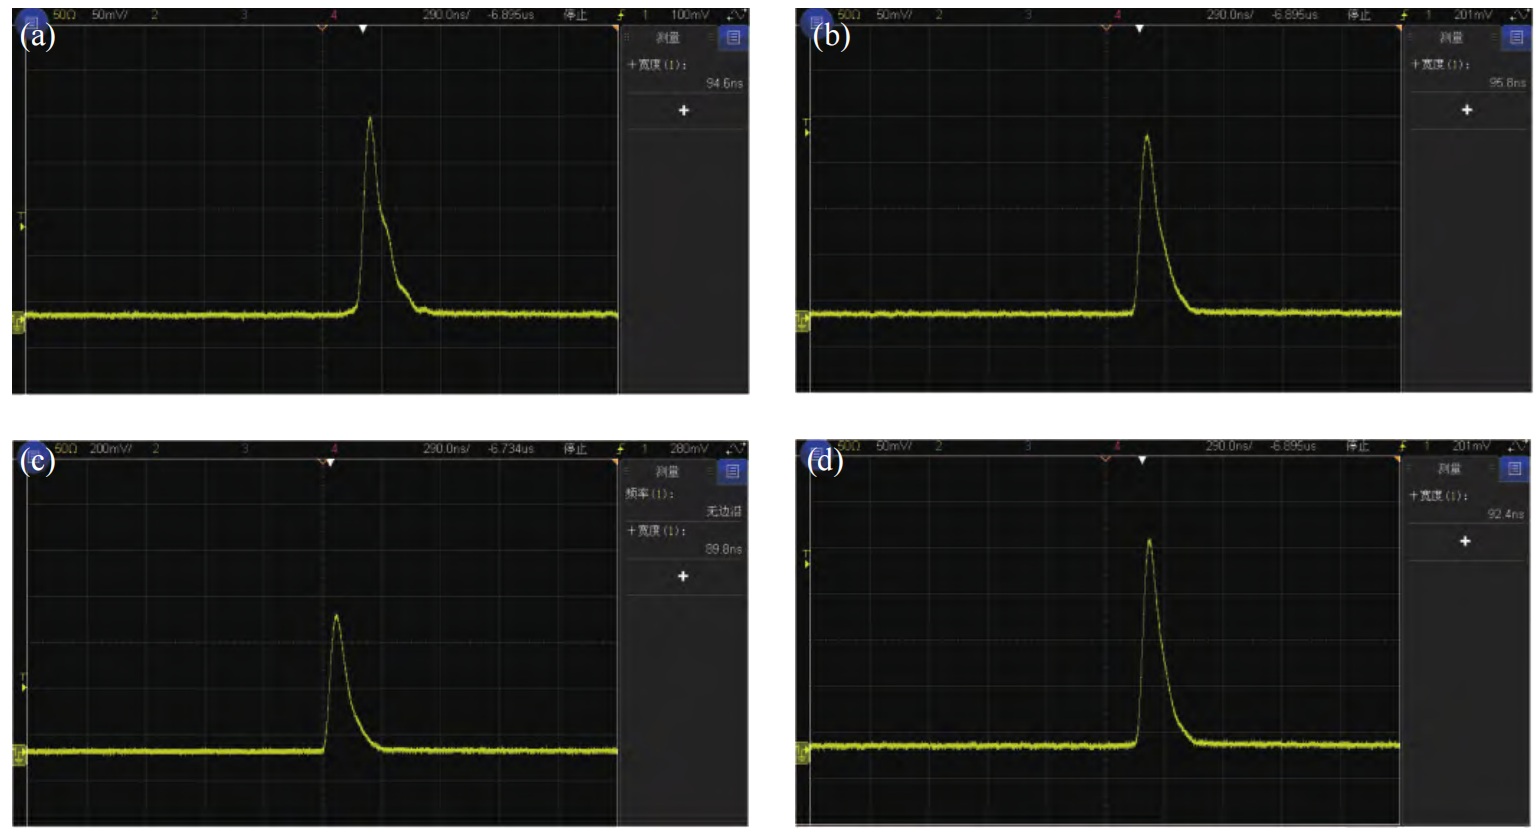
Fig. 9 The diagram of signal laser time domain characteristic under different output mirror transmittances. (a) HR; (b) T=10%; (c) T=20%; (d) T=30%