High-Power Mid-Infrared Ultrafast Sources at 2 - 5μm Based on Dual-Wavelength Source - Part 3
2 Mid-infrared theory and simulation based on PPLN crystal difference frequency generation
The process of ultrashort pulses generating mid-infrared in the PPLN crystal (www.wisoptic.com) is described by the three-wave coupling equation:
Ai (z,τ) represents the complex amplitude of the i-th pulse, i = 1, 2, and 3 represent the idler, signal, and pump light of the difference frequency process, respectively. z is the distance along the optical propagation direction within the PPLN crystal. τ represents the relative time coordinate, given by τ = t - z/vg,3 ,where vg,i =მωi/მki represents the group velocity of the i-th pulse. β2,i is the group velocity dispersion of the i-th pulse. ωi and n2 represent the angular frequency and refractive index of the i-th pulse, respectively. c is the speed of light in vacuum. deff is the effective nonlinear coefficient, which is -27.2 pm/V in the PPLN. Δk = k3 − k2 − k1, represents the phase mismatch. The relationship between ∆k and the PPLN polarization period Λ satisfies |∆k| =2π/Λ.
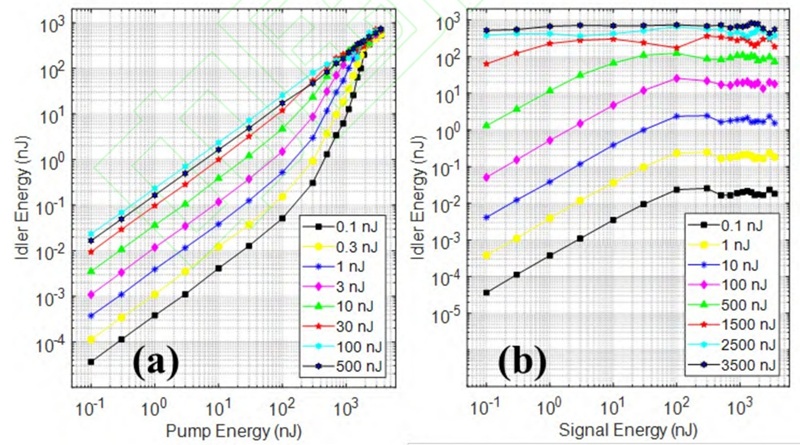
When the pump wavelength is 1.03μm, the corresponding PPLN polarization period varies between 30.6μm and 22μm as the output idler wavelength varies from 2.1μm to 6μm (signal wavelength 1.24μm to 2.02μm). To investigate the nonlinear interaction between pump and signal light in the PPLN crystal, we used the split-step Fourier method to solve Equations 1-3. Figure 2 plots the output idler energy versus pump energy as the signal energy varies from 0.1nJ to 500nJ (Figure 2(a)) and the output idler energy versus signal energy as the pump energy varies from 0.1nJ to 3.5μJ (Figure 2(b)). The central wavelengths of the pump and signal light were 1.03μm and 1.55μm, respectively, with a pulse width of 300fs. The pulse energy varied from 0.1nJ to 3.5μJ. The PPLN crystal was 3mm thick, with a polarization period of 29.7μm. The spot diameter at the center of the crystal was 150μm. The initial delay was set to 165fs, ensuring that the peaks of the pump and signal light pulses coincided at the center of the crystal.
Fig.2. The simulation curve of idle light energy varies with pump light and signal light energy.
As shown in Figure 2(a), when the pump power is low (<100nJ), the DFG process operates in the linear region. For all signal pulse energies, the idler power increases linearly with increasing pump power. As the pump power increases (100nJ-2000nJ), the DFG process enters the exponential region, where the idler power increases exponentially with the pump power. The exponential increase becomes more pronounced with decreasing signal power. When the signal pulse energy is 100nJ, the idler power even shows a decreasing trend as the pump power varies from 700nJ to 1000nJ. When the pump power exceeds 2000nJ, the DFG process operates in the saturation region. The idler power increases more slowly with increasing pump power, and the signal power has little effect on the output idler power. However, when the signal light energy increases from 0.1nJ to 500nJ, the pump pulse energy threshold for DFG to enter the saturation region decreases from 2000nJ to 700nJ. The results in Figure 2(b) show that the curve of the output idler light energy versus signal light energy includes a linear region and a saturation region. In the linear region, the pump and signal light energies are low, and the interaction is weak. As the signal light energy increases, the output idler light energy reaches saturation and oscillation occurs. Increasing signal light energy may lead to a decrease in the output idler light energy, consistent with the results shown by the light blue and black hexagonal stars in Figure 2(a). Furthermore, similar to the pattern in Figure 2(a), when the pump light energy increases from 0.1nJ to 3.5μJ, the signal light energy required for DFG to enter the saturation region decreases from 100nJ to 0.1nJ.


